Introduction #
A Social Media Report is an excellent tool to analyze the efficacy of our promotions, what kind of post generates more engagement and more.
You can find the reports on Google Drive > Marketing > Social Media > SM Metrics
The past reports are examples of how to present information. Feel free to improve them, adding additional kinds of information, comparisons, etc.
Getting info from Facebook #
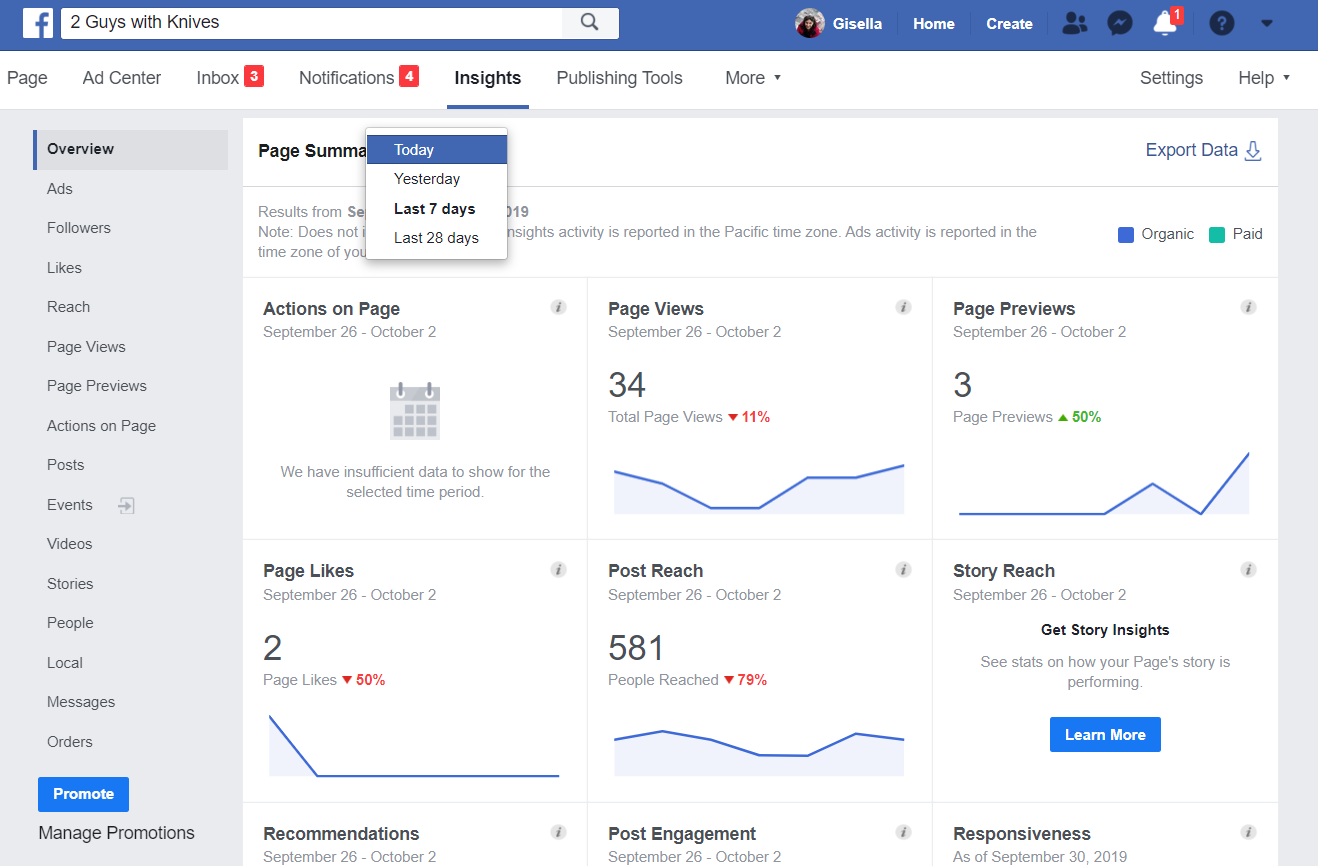
From our Facebook page, click on ‘Insight’ in the top menu.

The ‘Overview’ page has a brief summary of all metrics. You can choose to see the metrics for the current day, the previous one, the last 7 days and the last 28 days.
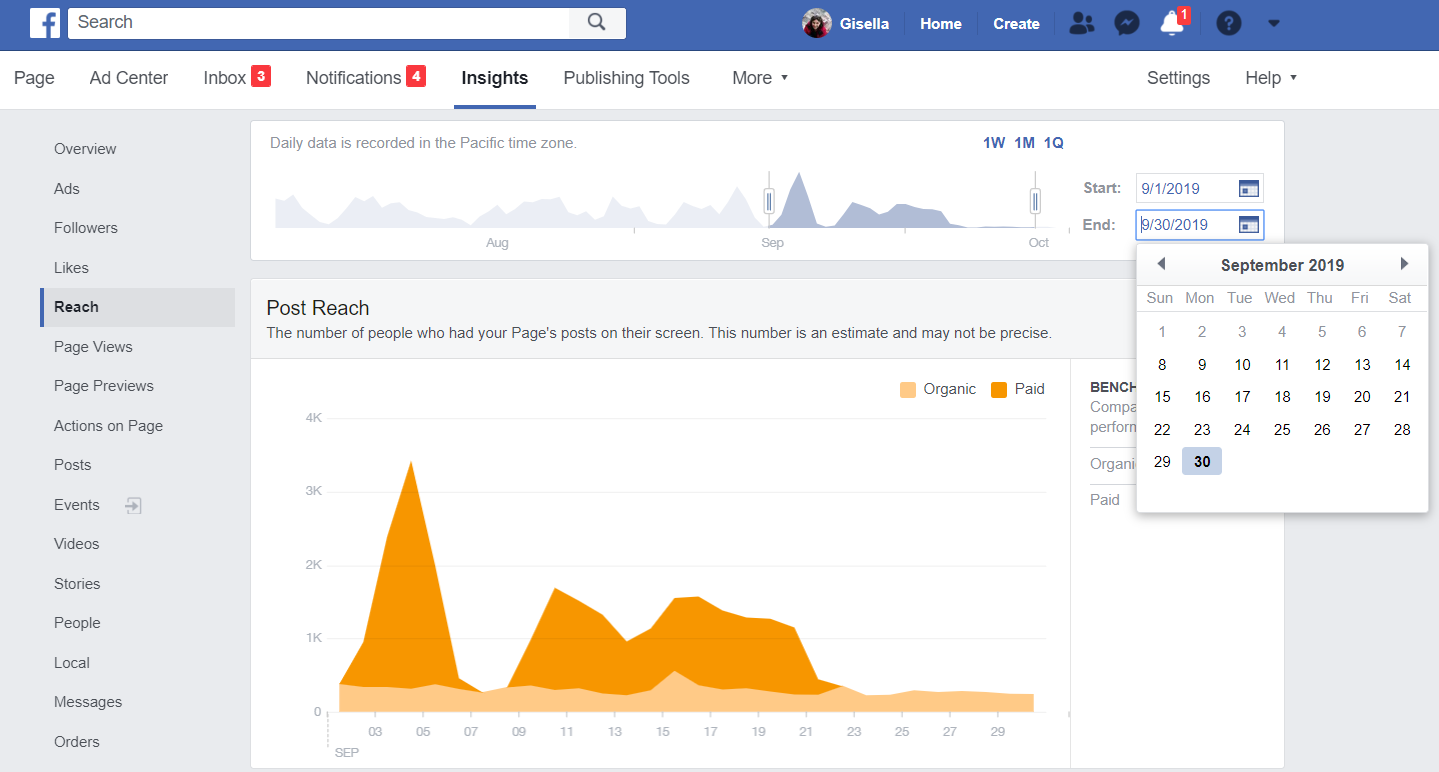
The ‘Reach’ page presents a graphic showing the number of people that saw our posts, day by day, separated by organic and paid. Note: the paid reach represents Facebook + Instagram.
For this metric, you can choose the start and end of the period you want to analyze.
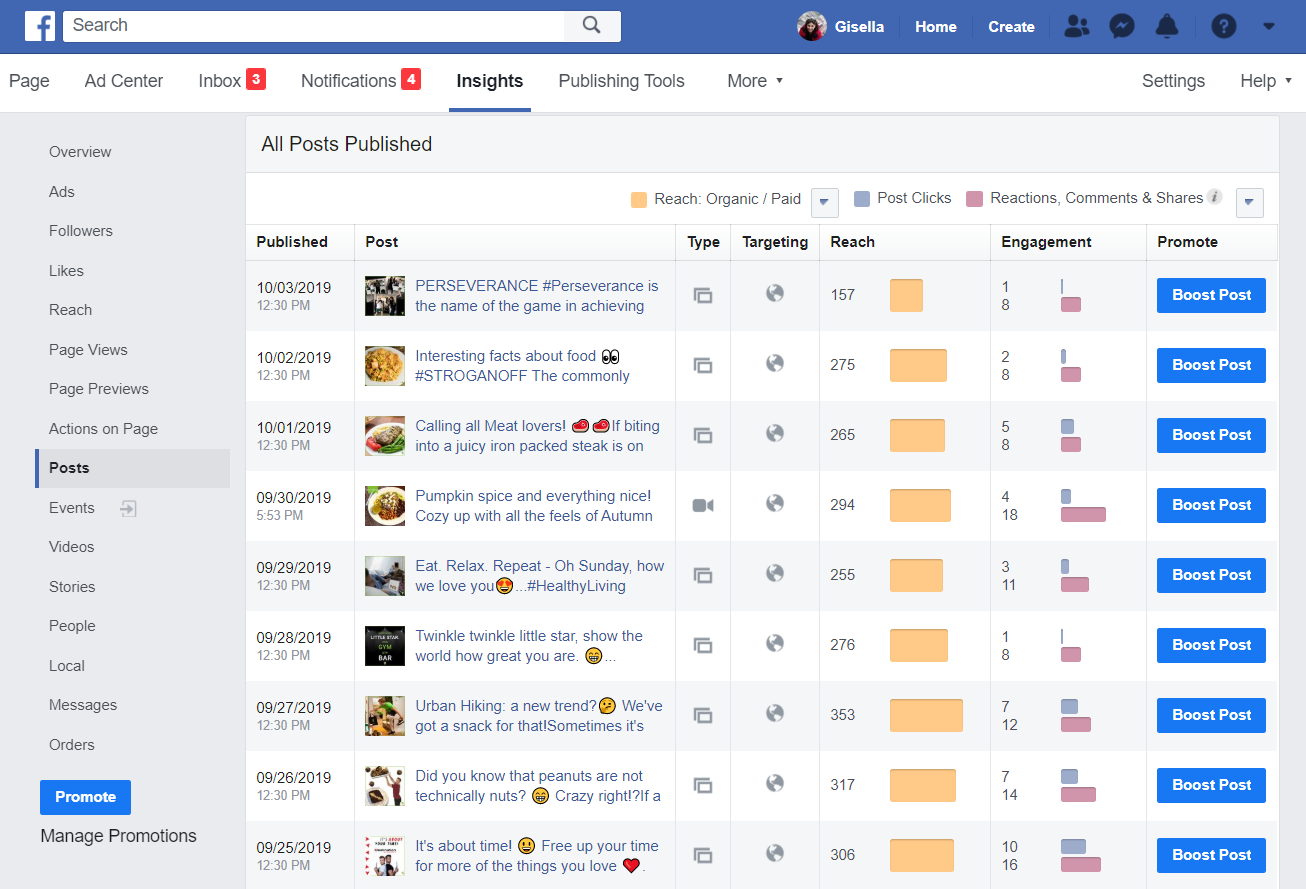
The ‘Posts’ page shows the performance of all posts, by reach and engagement. It’s a really good source to evaluate what kind of posts give us better results, and also can be a good call about what posts we should boost.
These are the most used metrics. Feel free to explore the other options too!
Getting info from Instagram #
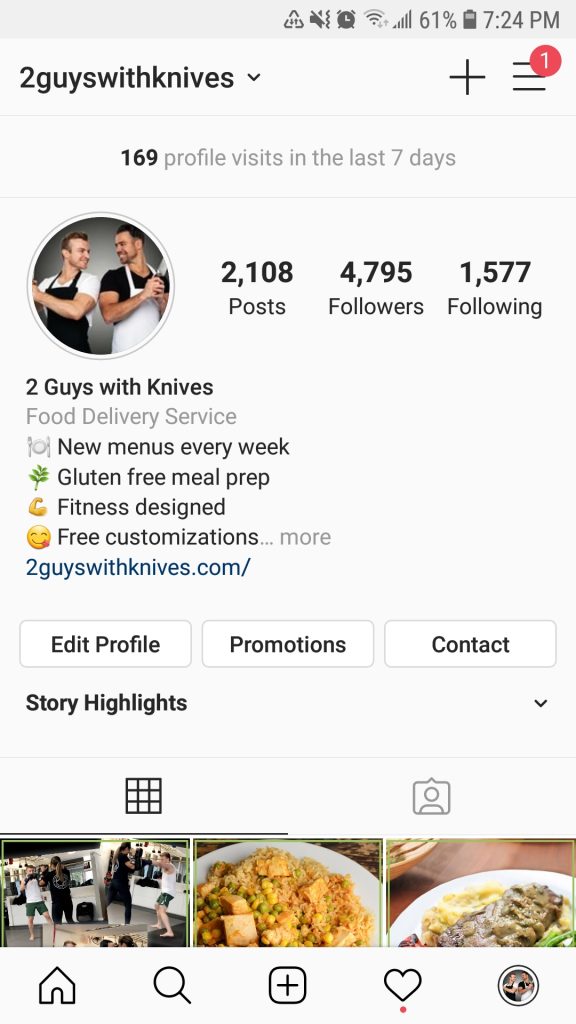
For Instagram, you can access the metrics through a mobile device.
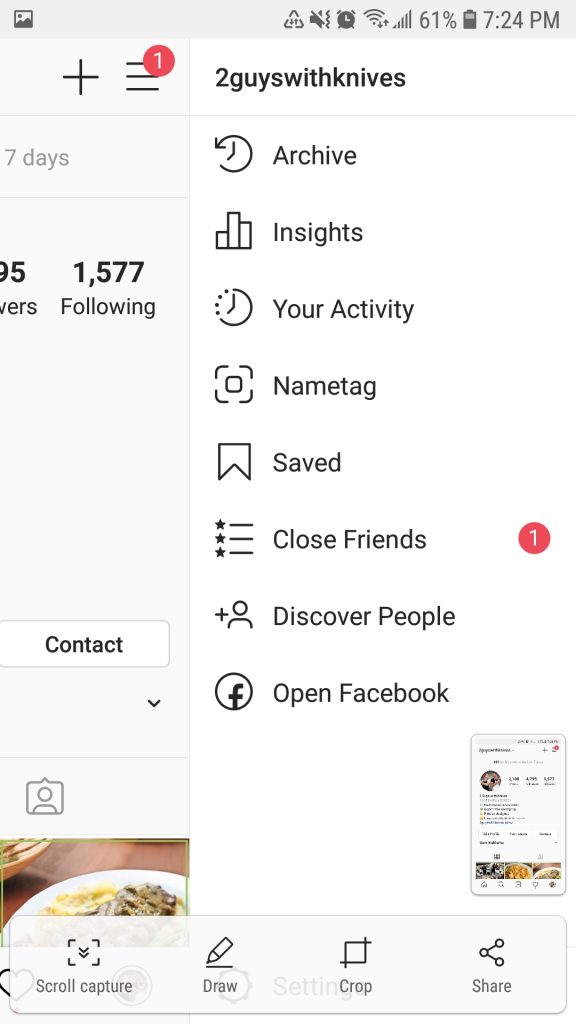
From the 2 Guys with Knives page, click on the ‘hamburger’ (the 3 lines on the top right of the page) to access the menu, then choose ‘Insights’.
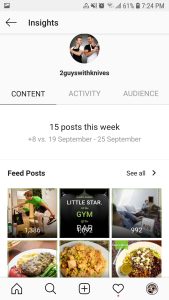
The first ‘Insights’ page is about the Content, where you can see posts and stories with better reach in the last 7 days. By clicking on ‘See all’, you will have more options to explore.
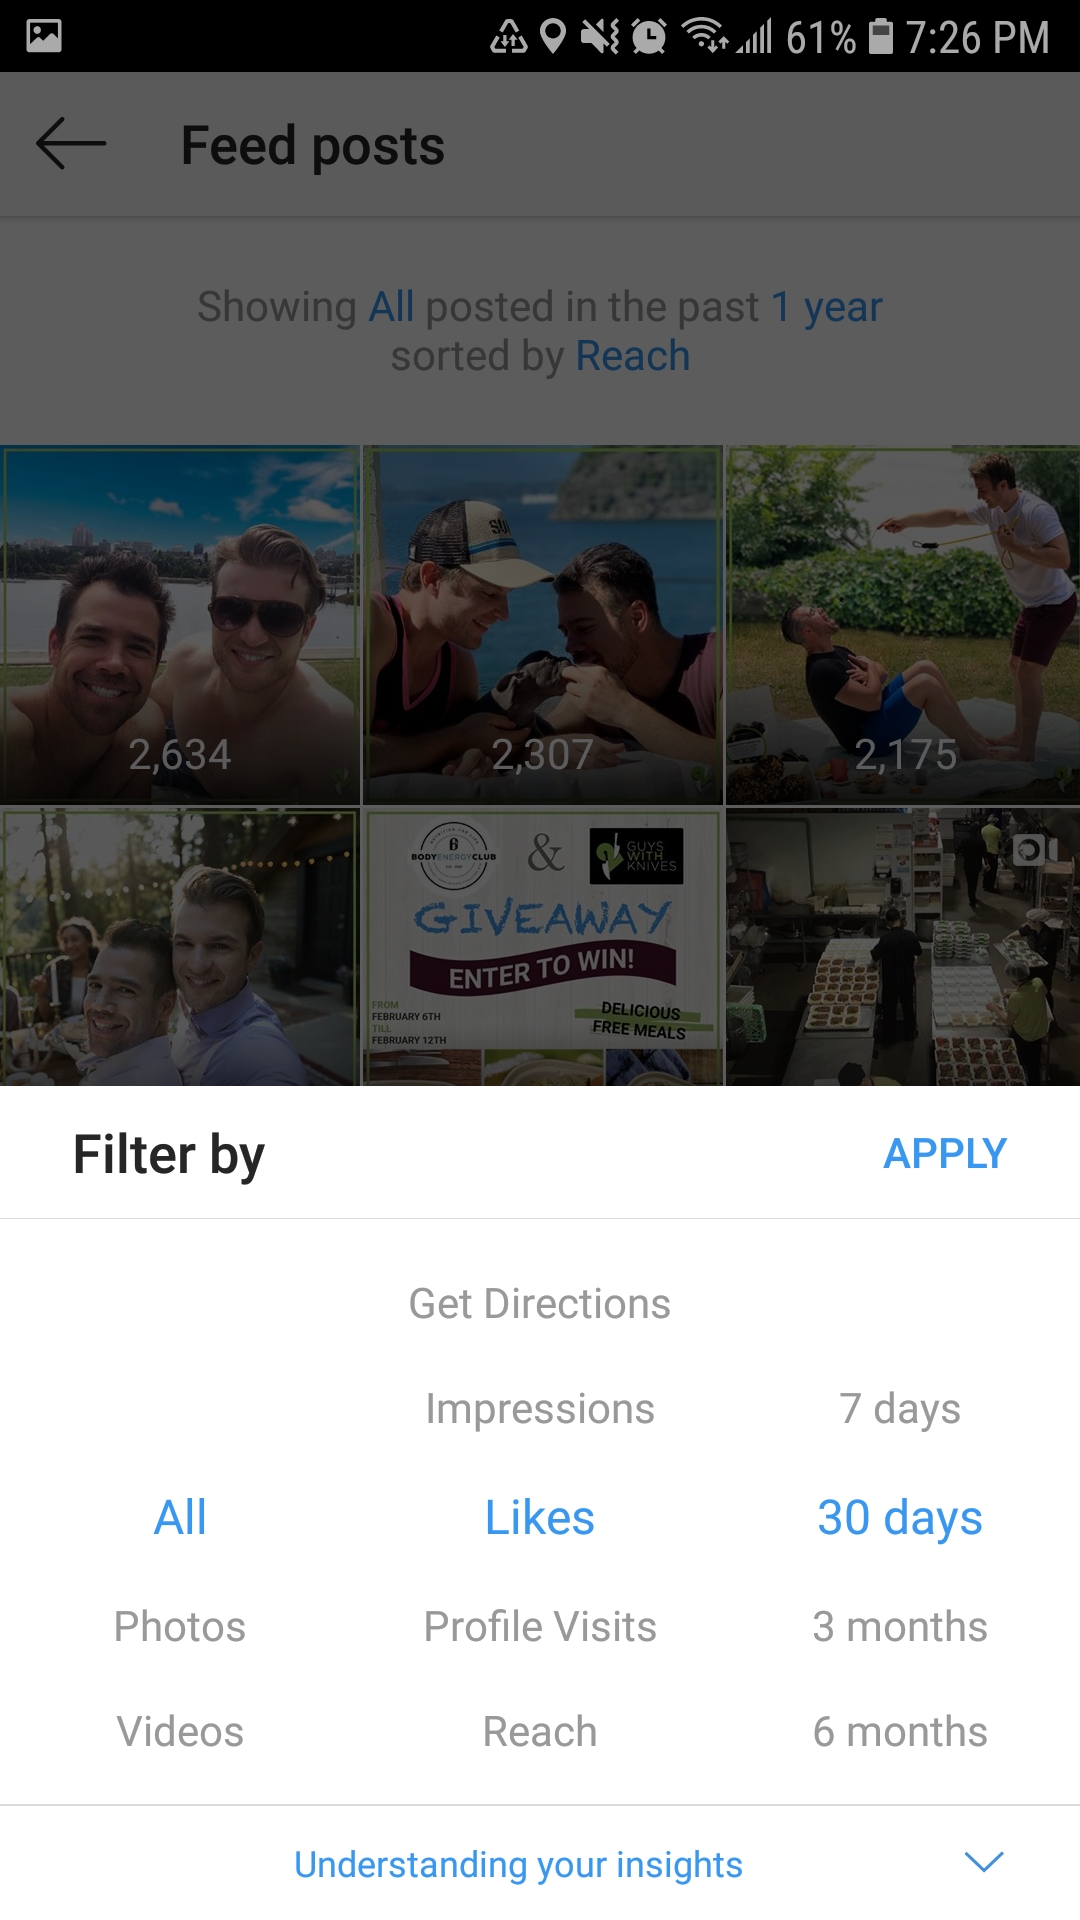
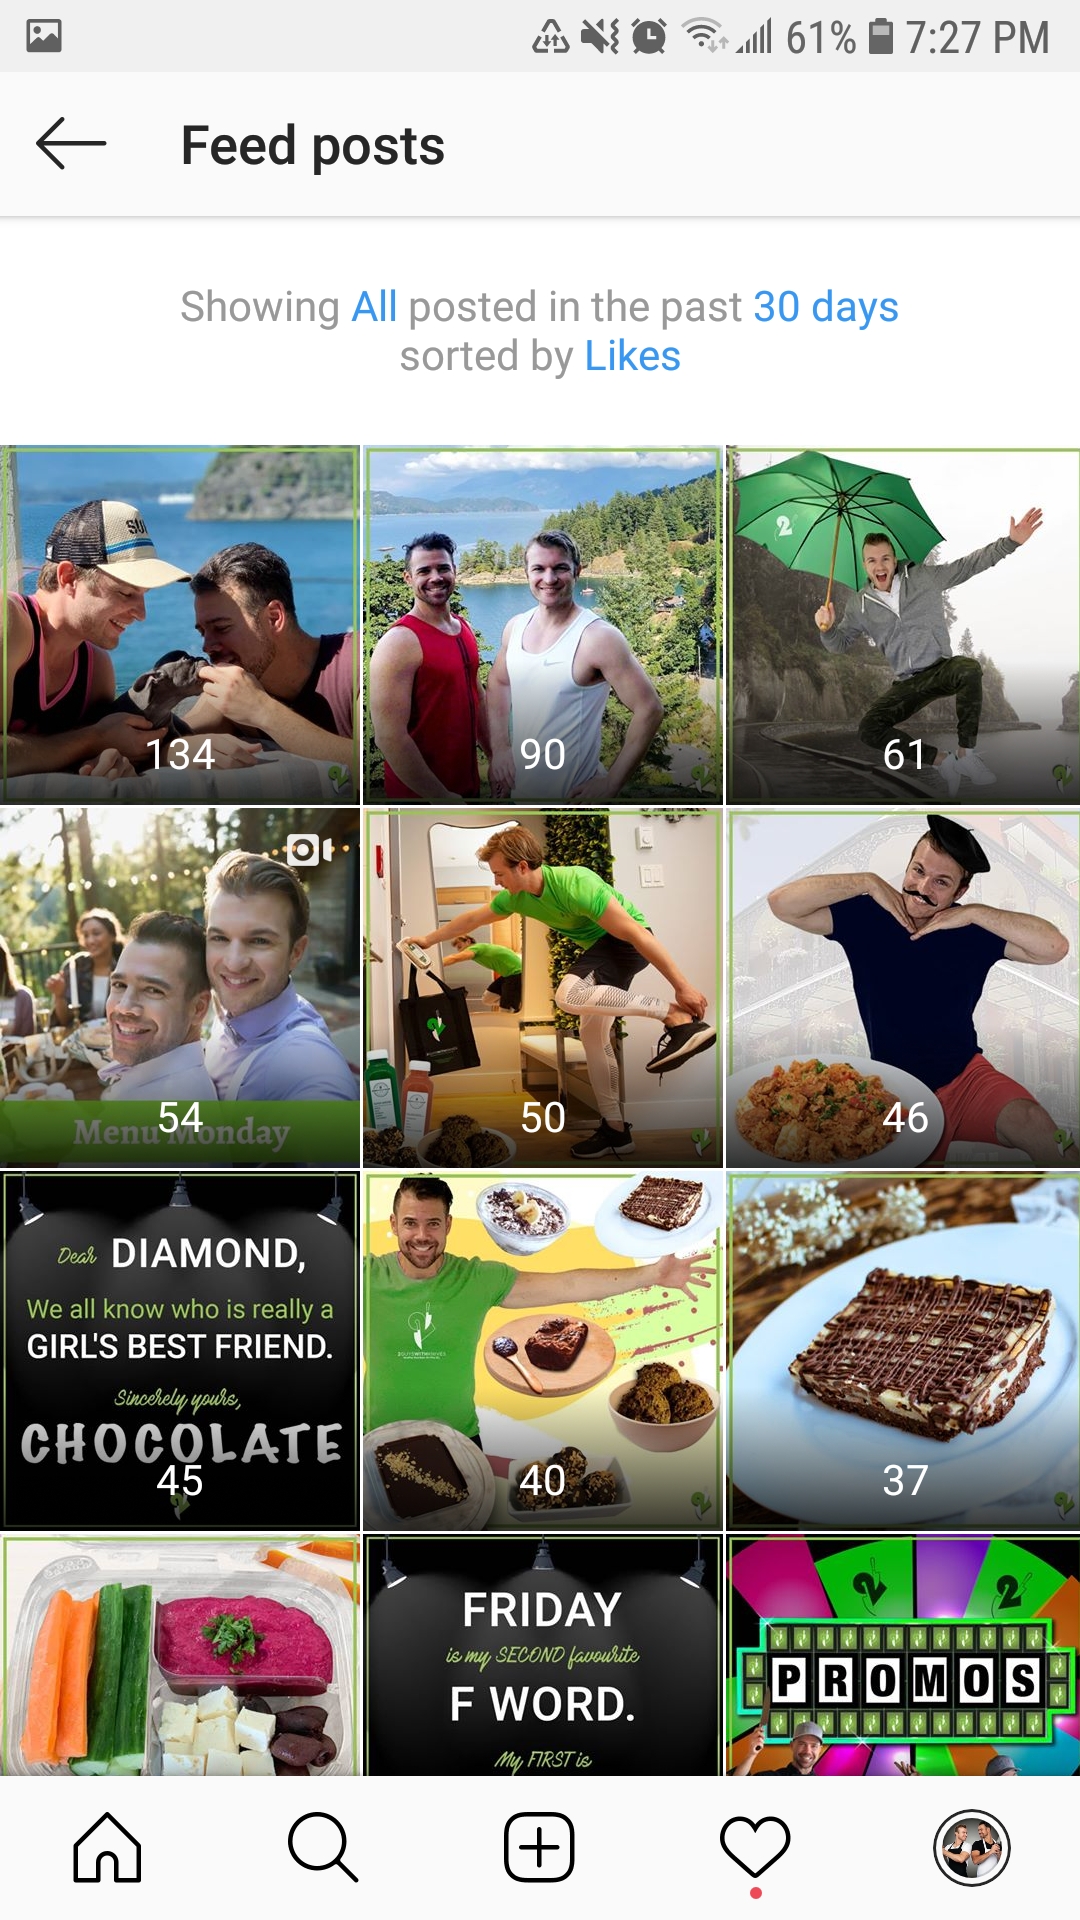
Click on any blue text, and choose the type of post, a metric and a period. For example All posts, Likes and 30 days.
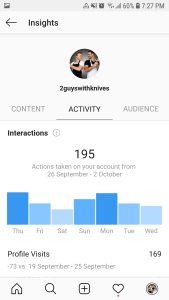
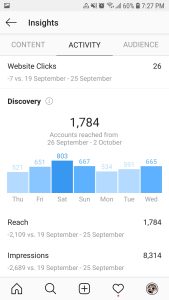
The next ‘Insights’ page is Activity, where you can see information about Profile Visits, Website Clicks, Reach and Impression. All the information is shown day by day and for the last 7 days.
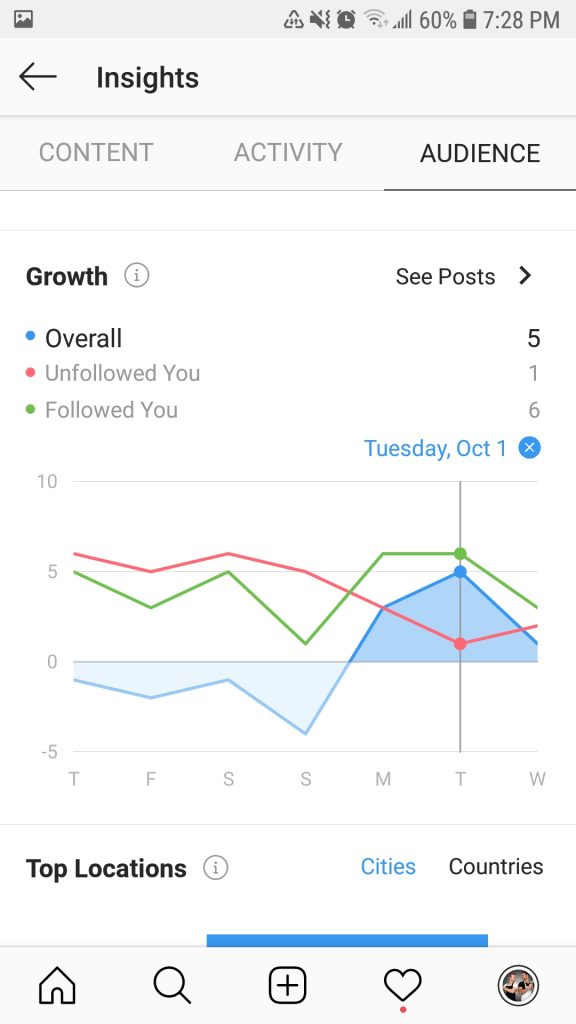
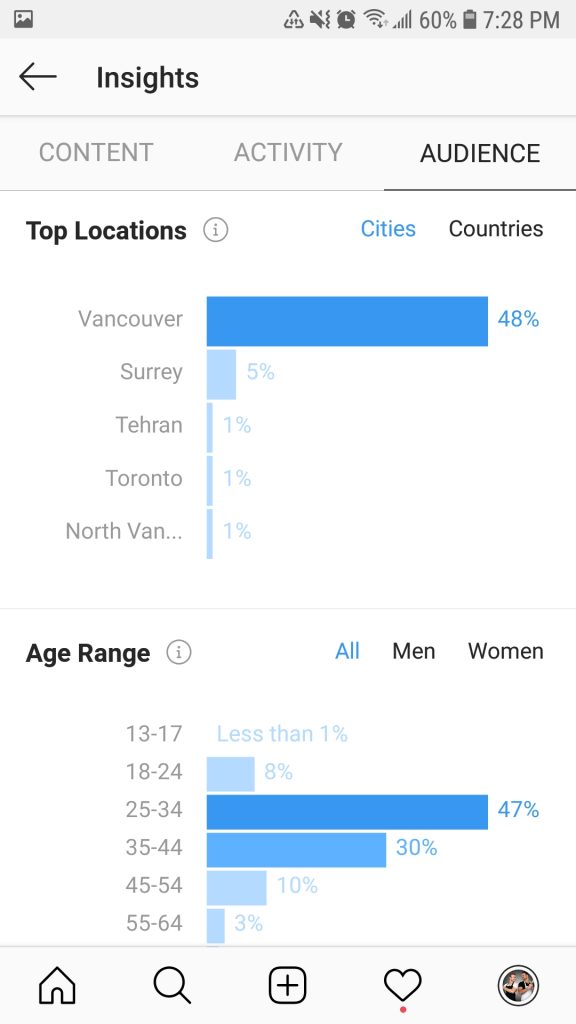
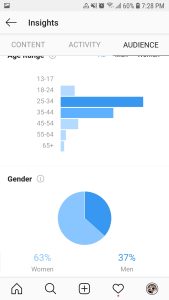
Finally, the last ‘Insights’page is about the Audience. Here you can find information about the audience growth, where people are located, their age and gender. Again, all the information is shown day by day and for the last 7 days.
Getting info from Twitter #
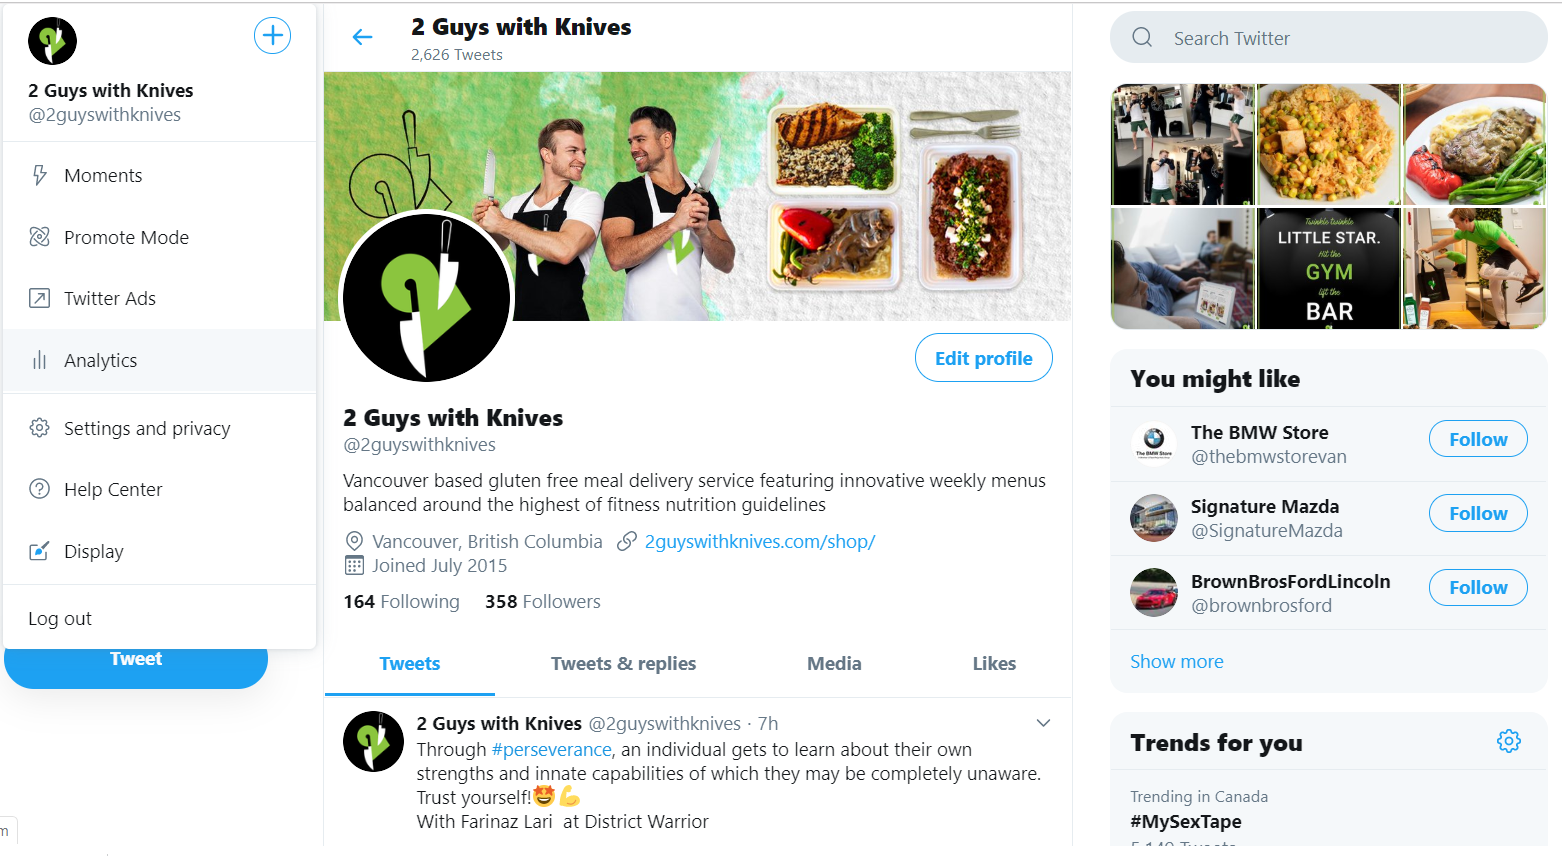
On Twitter, from the 2 Guys with Knives page, click on ‘More’ on the left menu, then choose ‘Analytics’.
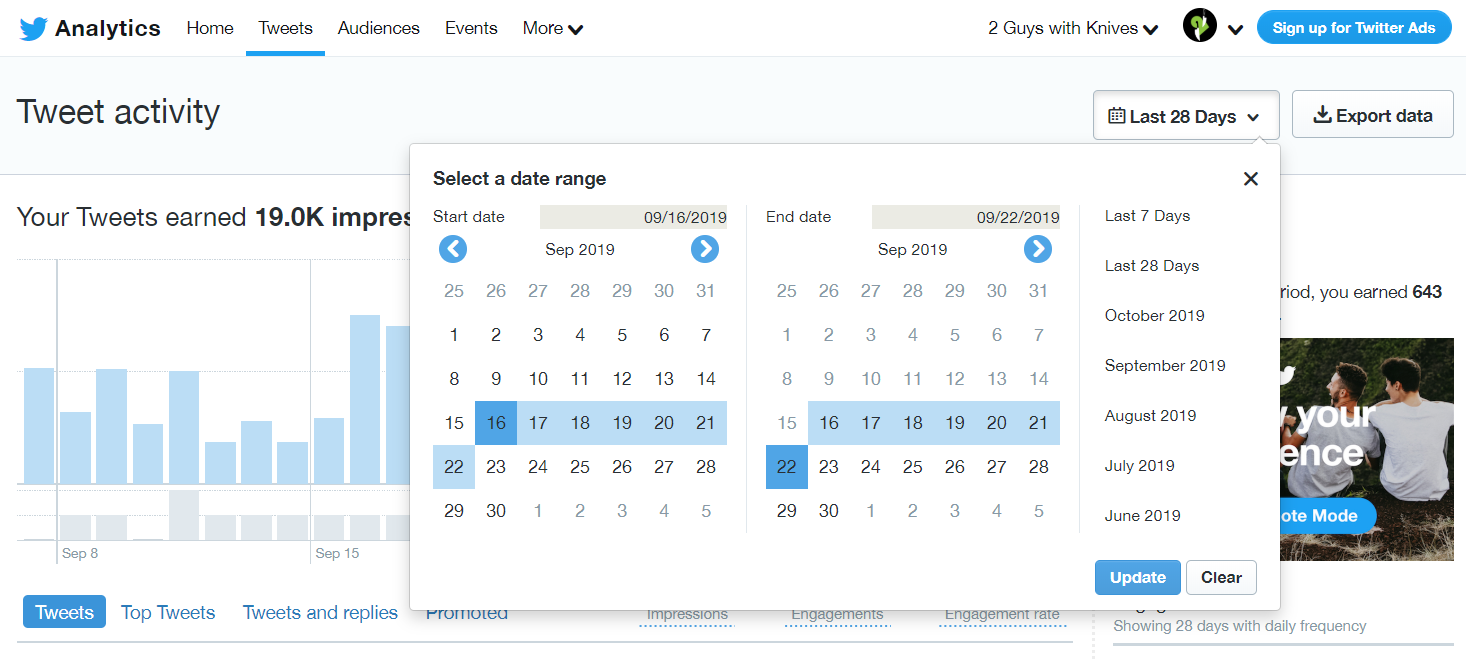
Once in the ‘Analytics’ page, select ‘Tweets’ from the top menu. Click on the button ‘Last 28 days’ to choose a date range.
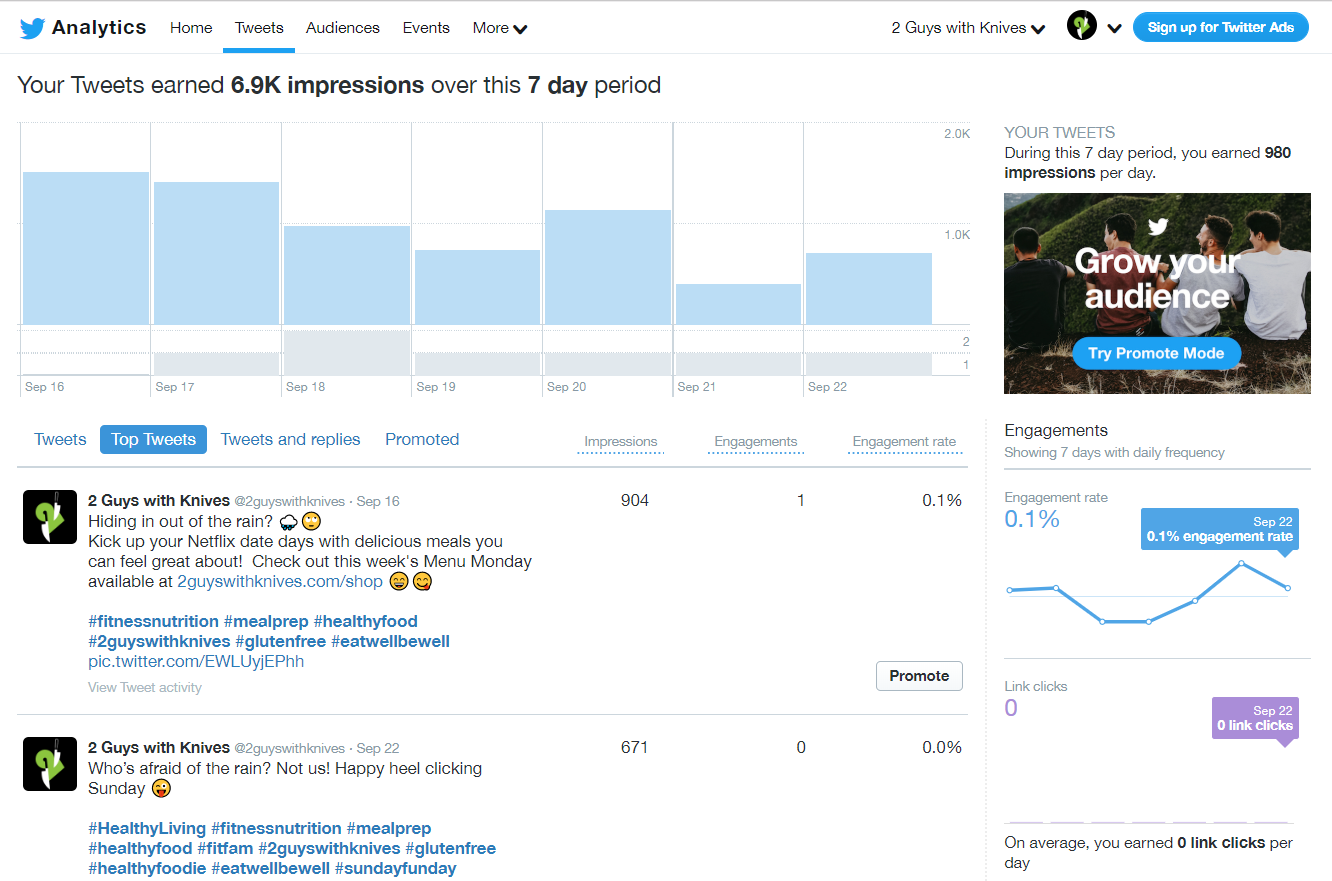
From here, you can see Impressions day by day, Engagements metrics, and which tweets had better performance.
These are the most used metrics. As Facebook, Twitter has some other metrics that you are free to explore!
Putting it all together #
After getting all the information, it’s time to build a report. At 2 Guys with Knives, you will build weekly and monthly reports. To more effectively showcase results, you can take screenshots of the Insights of each channel. When possible, compare the results with the previous week, so you can spot what’s working and what requires improvements.
WEEKLY REPORT
It should contain:
- A Cover, specifying the week – example: Sep 23rd to Sep 29th
- Facebook
- Overview
- Overall reach
- Number of total likes and followers and the number of new likes and followers from last week
- Post results, highlighting the top 3
- Promotions – if you have any boosted post or ad, show the results, including target, audience, investment, reach and engagement
- Instagram
- Number of total followers and the number of new followers from the last week
- Audience – Age range, Top locations, and Gender
- Overview – Discovery and Interactions
- Best posts
- Promotions – if you have any boosted post or ad, show the results, including target, audience, investment, reach and engagement
- Twitter
- Overview – number of total followers and the number of new followers from the last week, impressions and engagements
- Top 3 tweets of the week
- Conclusion
Here is an example of a weekly report: SM_metrics_AUGUST_26th
The weekly reports should be saved on Google Drive > Marketing > Social Media > SM Metrics >[Name of the Month]
MONTHLY REPORT
It should contain:
- A Cover, specifying the month- example: September 2019
- Overview
- Number of the followers of each channel
- Number of new clients that report finding 2 Guys with Knives through Social Media (You can get this information using the ‘Discovery Report’ on the website)
- Facebook
- Balance of the new followers vs. unfollowers
- Sponsored posts – results
- Instagram
- Balance of the new followers vs. unfollowers
- Sponsored posts – results
- Twitter
- Total impressions, with day-by-day graphic
- Top 3 tweets
- Conclusion
Here is an example of a monthly report: SM_metrics_AGO.2019
The monthly reports should be saved on Google Drive > Marketing > Social Media > SM Metrics
Feel free to improve these reports! The richer the information is, the better you can analyze the results achieved and propose new actions.


