Introduction #
Google Analytics is one of the best sources of information about the website. It lets us know when people are visiting, where they are coming from, how much time they spent, new visitors vs returning visitors, demographics and more.
You will use this tool for weekly & monthly reports which will directly impact your marketing strategies and proposals.
How to explore #
For any kind of information, you can choose the period you want to see: today, yesterday, last 7 days, last 28 days, custom. You can also choose to compare the selected period with the previous one, to analyze how everything is evolving.
Tip: as 2 Guys with Knives works on a 1-week cycle, it will be easier to compare results using weeks, so you can always compare, for example, a peak of visits on a Thursday with the peek of visits of another Thursday. Otherwise, you can end comparing the results, for example, on Thursday with one on Friday, and it can mislead the conclusion.
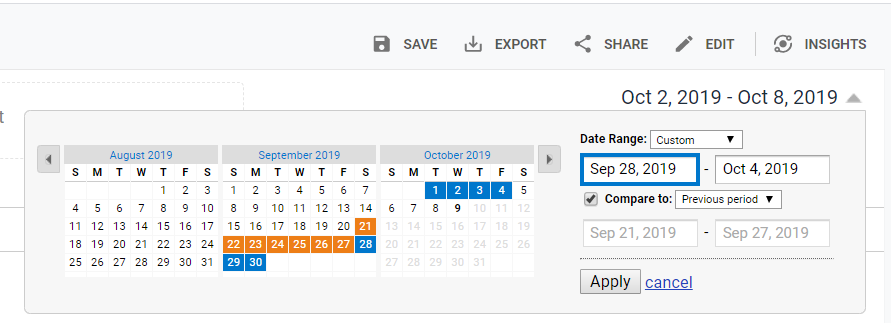
To pick a timeframe, go the date on the top right corner, and choose the period you want to analyze, and also if you want to do a comparison. The chosen timeframe will be represented by a blue colour, and the previous period in an orange colour. Click ‘Apply’.


One of the most useful reports is the ‘Aquisition’ > ‘All Traffic’ > ‘Channels’, where you can analyze: Users, New Users, Sessions, Bounce Rate, Pages / Session and Average Session Duration. All these results are divided by channel: Organic Search, Direct, Paid Search (Google Ads), Email marketing, Social Media and Referral.
By clicking on any of the channels, you can see more details about it. For example, by clicking on ‘Social’, you can see the visits generated by each social media platform.
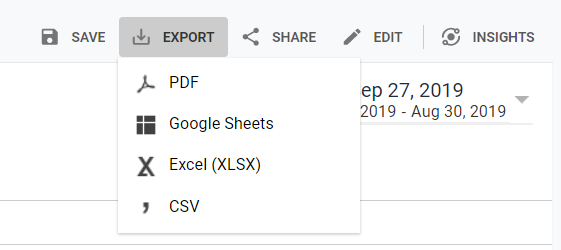
To download a report, go to the menu in the top right corner, click on ‘Explore’ and choose PDF.

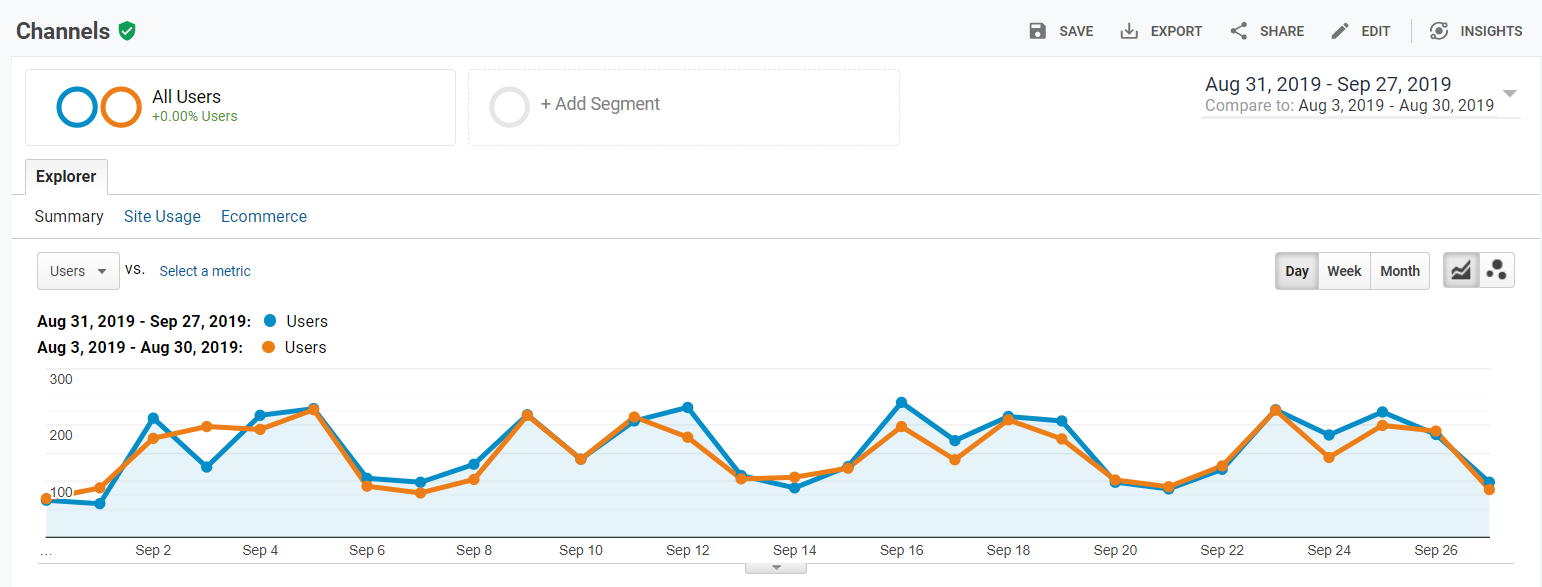
Here is an example of a Google Analytics report: Analytics _Channels 20190831-20190927.pdf


