Getting report from website #
First of all, you need to know where to get data for your report. For the Sales Report, it’s very easy: the website has all the information you need!
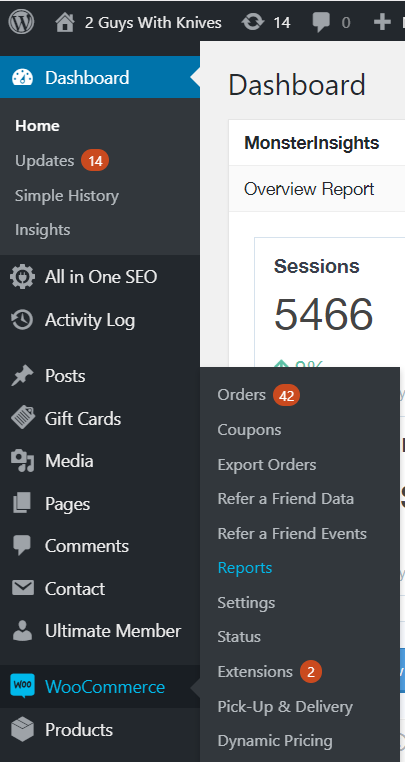
To start, in the website’s dashboard, go to WooCommerce > Reports
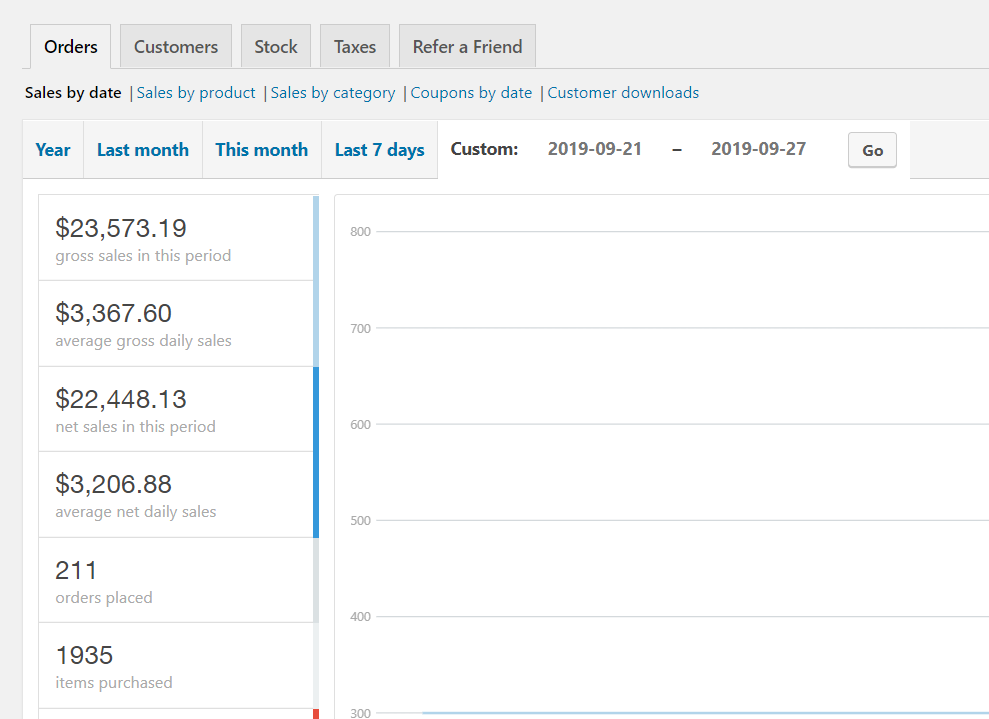
On the ‘Orders’ tab, go to ‘Custom’ and insert the time range of the week you are doing the report. Remember, you should pick always from a Saturday (when the weekly menu is published) until the following Friday (to include the ‘later orders’). Take a note of the ‘items purchased’ number.
Now, go to WooCommerce > Export Order

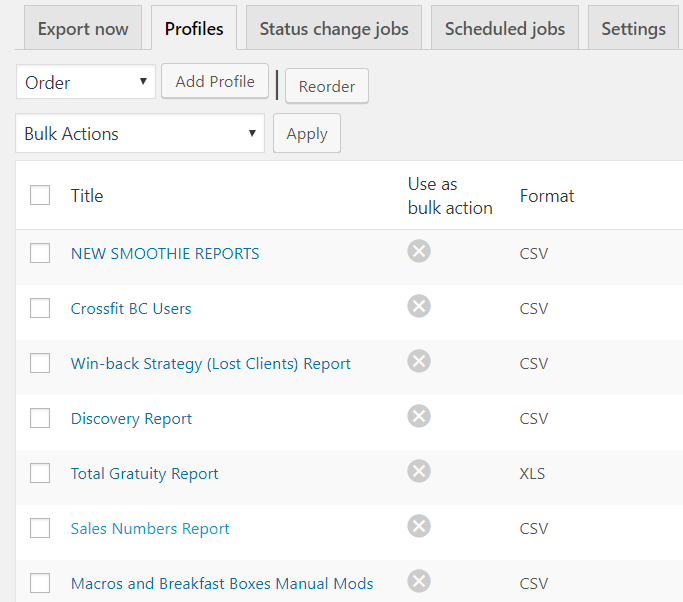
On the ‘Profile’ tab, click on ‘Sales Number Report’.
On ‘Date Range’, choose the same week you just used in ‘Orders’, and click on the ‘Express Report’ button. A CSV file will be downloaded to your computer.
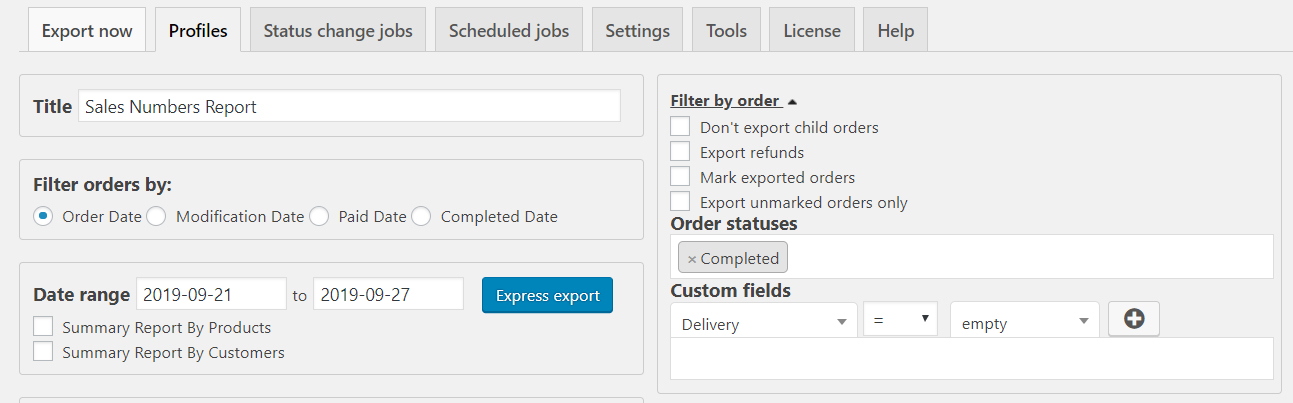
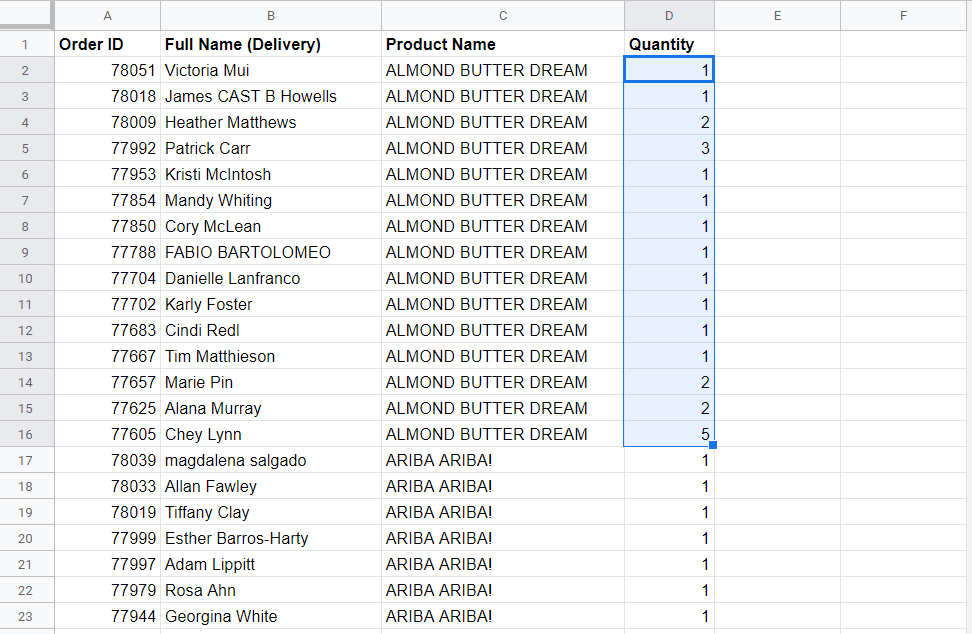
The CSV file will contain Order ID, client’s name, product’s name and quantity. Open the CSV on an Apple Number’s document (or another spreadsheet of your choice), and sort it by ‘Product Name’. Now it will be easy to know how much of each product was sold.
Great! Now you got all the information you need to update the sales report!
Updating report – fixed menu #
This report is located in Google Drive > Sales > SALES TRACKING > Weekly Product Sales. Or go directly to this link.
Let’s start with the ‘menu – fixed items’ spreadsheet.
That number that you took note from the website, the ‘items purchased’ number, should be written in the ‘Total’ row, in the correspondent week column.
Here, each product, you will write the quantity sold in the correspondent week. For the percentages for the category and total, simply copy the formula of the previous week, for the same product.
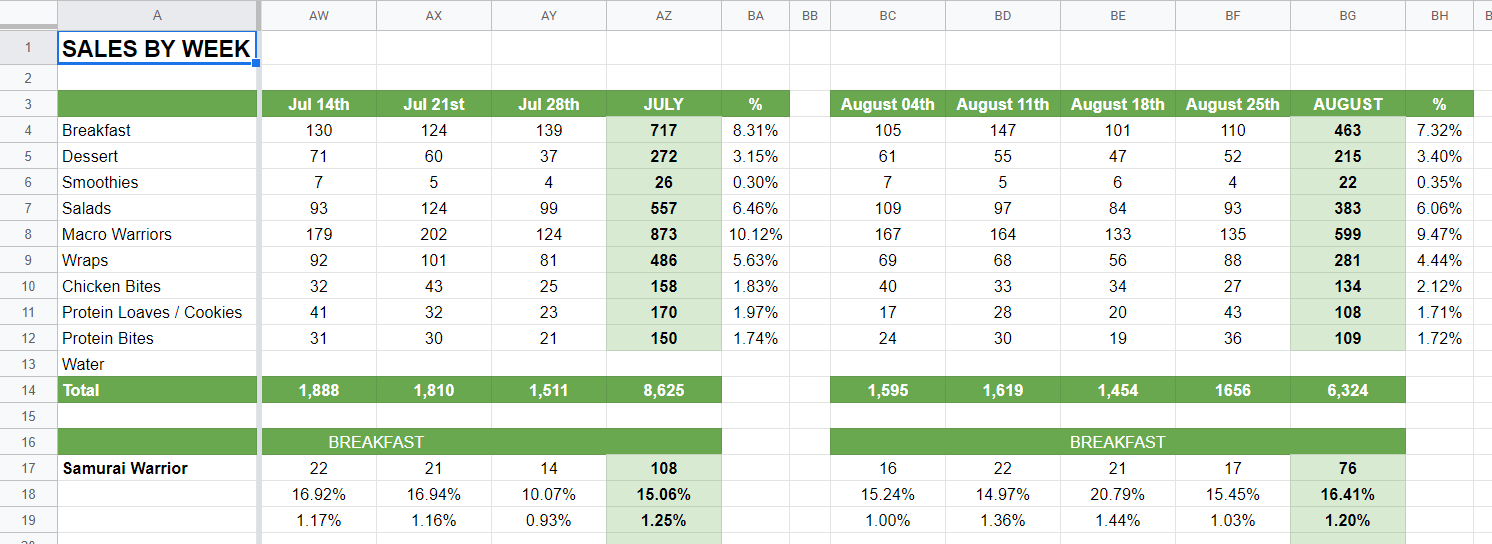
If there is any new product, add rows for it in the appropriate category area (Breakfast, Salads, etc). Remember to adjust the SUM formula of the category on the top of the spreadsheet to include the new item.
Note that the rotating item of the menu – Entrees, Juices, Wellness Shots, Bottled Smoothies and Soups (this only in the winter) – will be on the other spreadsheet, ‘rotating menu’, and we will talk about on the next step.
Updating report – rotating menu #
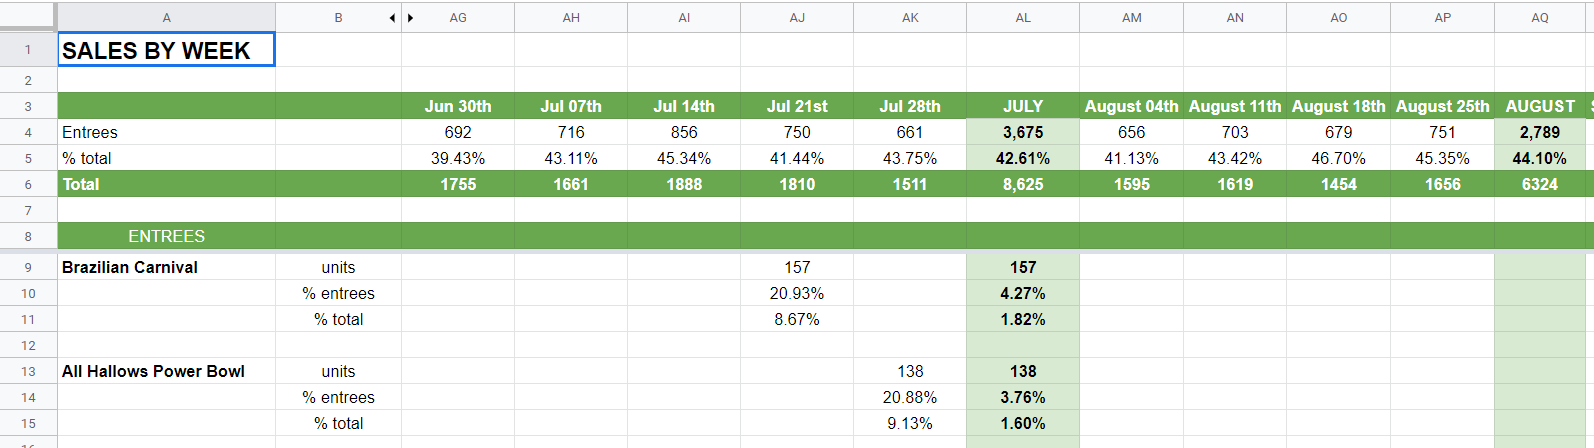
Now go to the next spreadsheet, ‘rotating menu’. This spreadsheet is similar to the previous one, but the numbers are spread, as the items don’t are sold with regularity.
Again, that number that you took note from the website, the ‘items purchased’ number, should be written in the ‘Total’ row, in the correspondent week column, and for each category (Entrees, Juices, Wellness Shots, Bottled Smoothies and Soups – this only in the winter).
Once more, for each product, you will write the quantity sold in the correspondent week. For the percentages for the category and total, simply copy the formula of the previous week, for a similar product.
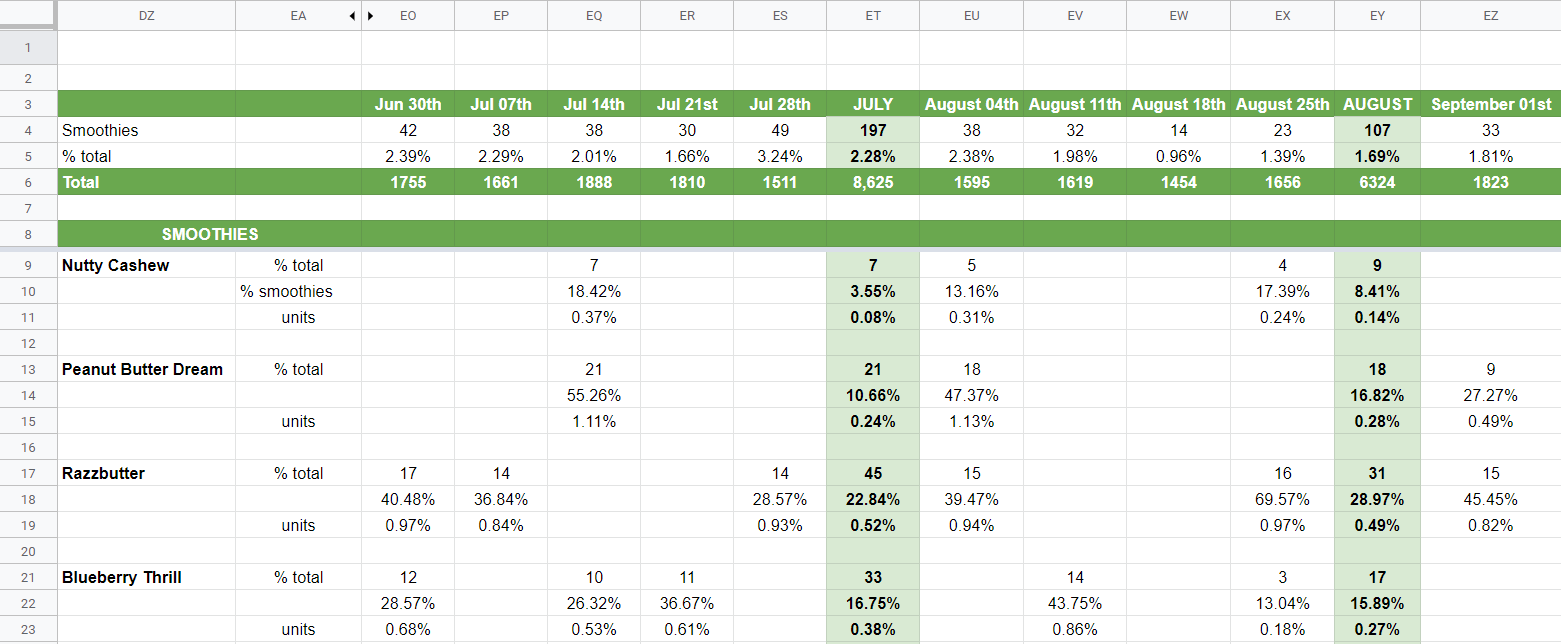
If there are any new products, add rows for them in the appropriate category areas.
For each category, the SUM formula should be added manually, due to product variation for each week.
Great work! On the next step, let’s see what to do with this bunch of information!
How to analyze #
When you have the report updated, what you should analyze and highlight:
- Compare the performance of total sales and by category with the numbers from the previous week.
- Also, compare sales with the rest of the year, analyze if there is any tendency of product increasing or decreasing sales.
- Highlight if any product or category had a special performance (good or bad)
- When possible, try to connect events with sales (was it a week with a holiday? did you do any promotions on social media?)
Some examples:
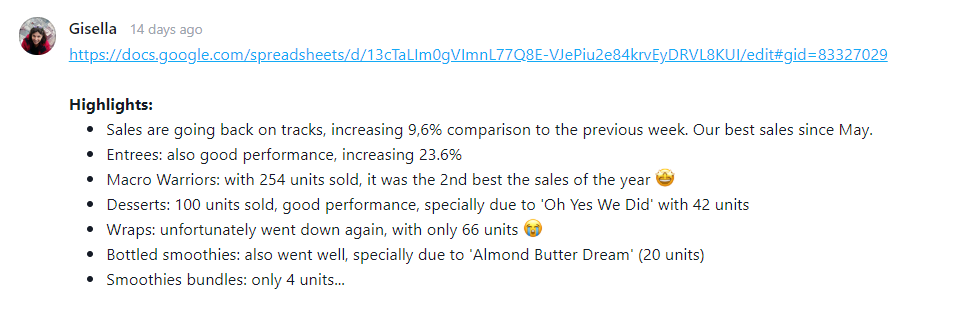
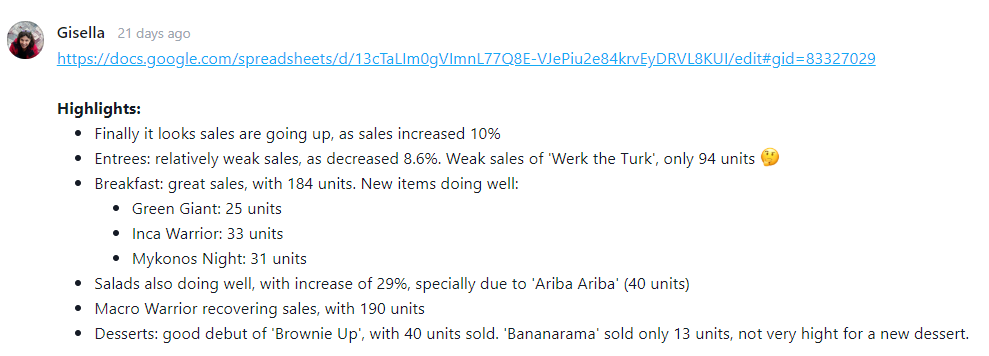
Your analyse will help Patrick and Sergio in making adjustments to the menu, highlighting products that maybe need a replacement, or having an outstanding performance.


